Documentation / Daily work
Sales reports and analytics
Which reports exist, the date ranges they use, and how to check the numbers.
Available reports
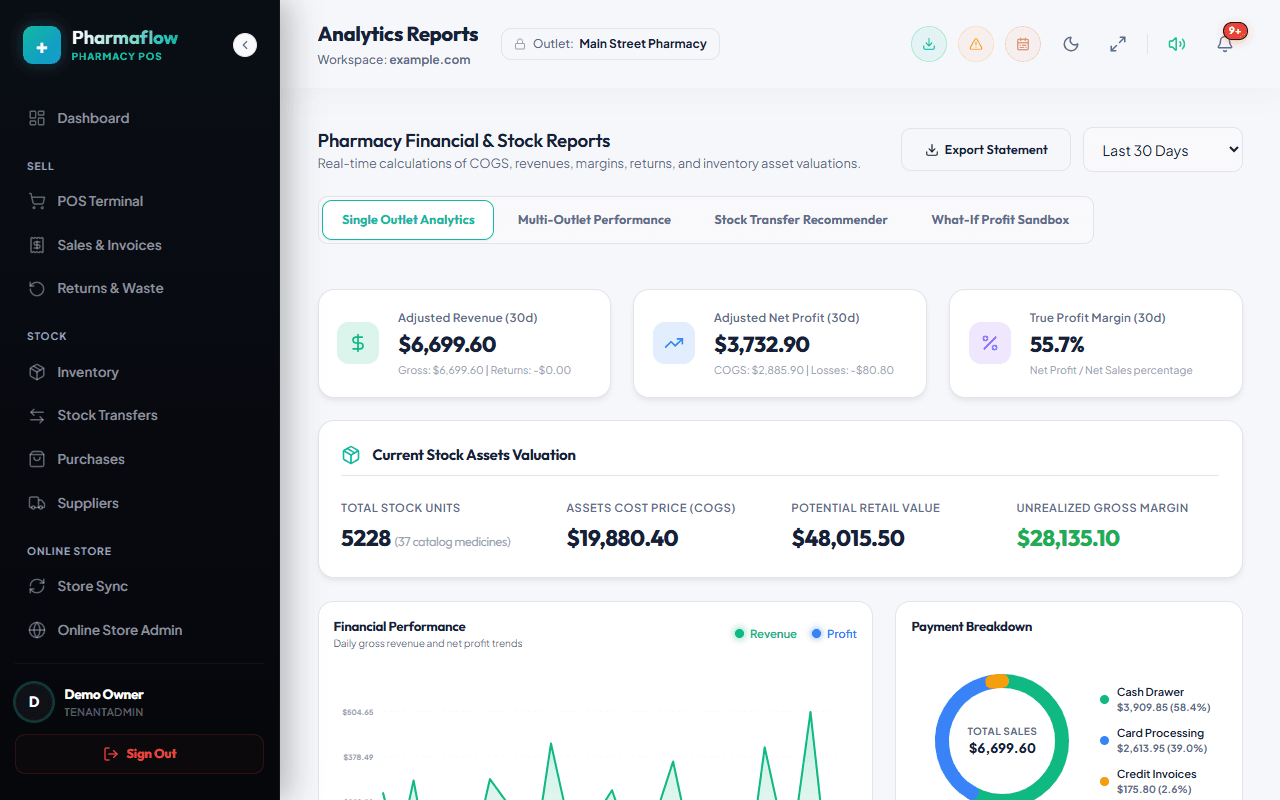
Owners open Reports & Analytics. The first tab, Single Outlet Analytics, shows:
- Adjusted revenue: sales for the period minus returns.
- Adjusted net profit: adjusted revenue minus the cost of goods sold and recorded losses (waste and write-offs).
- True profit margin: net profit divided by net sales.
- Current stock valuation: units on hand, their cost price, their potential retail value and the unrealised margin between the two.
- Financial performance (daily revenue and profit) and payment breakdown (cash, card, credit).
The other tabs compare outlets, suggest stock transfers between branches, and run what-if scenarios. The what-if tab is a planning sandbox: its results are projections, not recorded figures.
Date ranges
The selector at the top right (for example Last 30 Days) sets the period for the figures labelled with that period, such as “(30d)”. The stock valuation always describes stock on hand right now, whatever period is selected.
Checking a number
Totals are sums of records you can open: Sales & Invoices, Purchases, Returns & Waste and the batches in Inventory. If a total looks wrong, check the date range and the selected branch first, then see Troubleshooting.